基于Python的京津冀上广深空气质量数据可视化分析

1.无需注册登录,支付后按照提示操作即可获取该资料.
2.资料以网页介绍的为准,下载后不会有水印.资料仅供学习参考之用.
密 惠 保
基于Python的京津冀上广深空气质量数据可视化分析(论文17000字,HTML走势图)
摘要:2018年6月,国务院发布的《打赢蓝天保卫战三年行动计划》中明确提出了要扩大国家城市空气质量排名范围,包含京津冀及周边地区、长三角地区、汾渭平原等重点区域和珠三角、成渝、长江中游等地区的地级及以上城市,以及其他省会城市、计划单列市等。由此可见,国家高度重视城市空气质量。空气污染是世界众多工业城市所面临的最为严重的环境问题。进行空气质量监测、数据分析和可视化研究能够全面掌握城市空气污染源的排放数据与不同空气污染物在不同空间区域内的浓度数据,能够对影响城市空气质量的因素有所了解与把握,同时对污染控制、环境管理和公共事业发展均有一定的理论意义和实用价值。基于国家政策要求的这个大背景,很有必要对代表城市京津冀上广深空气质量的数据进行研究分析并进行可视化呈现。Python软件平台能够使数据可视化的呈现效果更为直观利于对比分析,利用其强大的库爬取数据与分析可视化的结果较为方便。本文以当前热门编程语言Python作为开发工具,利用Python的BeautifulSoup库进行网页爬虫以获取空气质量数据,如最具代表的AQI、PM2.5,然后综合运用第三方库Pandas进行数据处理,最后利用Python的pyecharts库对空气质量数据进行可视化图形呈现,该设计具体实现了京津冀上广深空气质量数据的爬取、处理以及图形输出等功能。 [资料来源:THINK58.com]
关键字:蓝天保卫战、空气污染、空气质量数据、Python、数据可视化
Data visualization analysis of air quality in Beijing, Tianjin,Shijiazhuang,Shanghai, Guangzhou and Shenzhen based on python
Abstract: In June 2018,the "Three-Year Action Plan for Winning the Blue Sky Defence War" issued by the State Council clearly stated that it is necessary to expand the national urban air quality ranking range, including key areas such as Beijing-Tianjin-Hebei and surrounding areas, the Yangtze River Delta region, and the Yan Plain. And the prefecture-level and above cities in the Pearl River Delta, Chengdu, and the middle reaches of the Yangtze River, as well as other provincial capital cities and planned cities.This shows that the country attaches great importance to urban air quality. Air pollution is the most serious environmental problem facing many industrial cities in the world. Air quality monitoring, data analysis and visualization studies can fully grasp the emission data of urban air pollution sources and the concentration data of different air pollutants in different spatial regions, which can understand and grasp the factors affecting urban air quality, and at the same time control, environmental management and public utility development have certain theoretical significance and practical value. Based on this background of national policy requirements, it is necessary to conduct research and analysis on the data representing the Beijing,Tianjin,Shijiazhuang, Shanghai, Guangzhou and Shenzhen air quality.The Python software platform makes the visualization of data visualization more intuitive and convenient for comparative analysis. It is convenient to use its powerful library to crawl data and analyze the results of visualization.This article uses the current popular programming language Python as a development tool, using Python's BeautifulSoup library for web crawling to obtain air quality data, such as the most representative AQI, PM2.5, and then using the third-party library Pandas for data processing, and finally using Python The pyecharts library visualizes the air quality data. The design specifically implements the functions of crawling, processing and graphic output of air quality data. [资料来源:www.THINK58.com]
Keywords:Blue Sky Defense, air pollution, Python, data visualization, AQI, PM2.5

目 录
摘要……………………………………………………………………Ⅳ
第1章 绪论……………………………………………………………1
1.1 研究目的和意义………………………………………………………………………1
1.1.1 研究目的………………………………………………………………………1 [资料来源:http://think58.com]
1.1.2 研究意义………………………………………………………………………1
1.2 国内外研究现状………………………………………………………………………1
1.2.1 国内研究现状…………………………………………………………………1
1.2.2 国外研究现状…………………………………………………………………2
1.3 研究内容………………………………………………………………………………3 [来源:http://think58.com]
1.4 预期效果………………………………………………………………………………3
第2章 技术背景………………………………………………………4
2.1 Python语言简介………………………………………………………………………4
2.2 Python的广泛用途……………………………………………………………………4
2.3 Python的编译环境PyCharm…………………………………………………………5
[来源:http://www.think58.com]
2.4 Python对气象数据的可视化…………………………………………………………5
2.5 本章小结………………………………………………………………………………6
第3章 网页爬取空气质量数据………………………………………6
3.1 网页爬虫简介…………………………………………………………………………6
3.1.1 爬虫技术简介…………………………………………………………………6
3.1.2 Python编写网络爬虫的优点…………………………………………………6
3.1.3 爬虫的工作原理………………………………………………………………6
3.1.4 网络爬虫模块…………………………………………………………………7
3.1.4.1 系统模块………………………………………………………………7
3.1.4.2 网络爬虫的基本工作流程……………………………………………7
[资料来源:http://think58.com]
3.2 空气质量数据的选取…………………………………………………………………8
3.2.1 AQI简介………………………………………………………………………8
3.2.2 PM2.5简介……………………………………………………………………8
3.2.3 空气质量数据的选取…………………………………………………………8
3.3 空气质量等级的确定…………………………………………………………………8 [资料来源:http://think58.com]
3.4 网页的选择……………………………………………………………………………10
3.5 爬虫程序设计并实现…………………………………………………………………10
3.5.1 网页抓取数据过程中的相关模块或库………………………………………10
3.5.1.1 time模块………………………………………………………………10
3.5.1.2 requests库……………………………………………………………10
[资料来源:THINK58.com]
3.5.1.3 BeautifulSoup库……………………………………………………11
3.5.2 网页分析以及空气质量数据的获取…………………………………………11
3.5.3 数据处理………………………………………………………………………13
3.6 本章小结………………………………………………………………………………14
第4章 数据可视化的图形输出………………………………………14
4.1 数据可视化的相关类库………………………………………………………………14
4.2 数据结构DataFrame的简介…………………………………………………………15
4.3 数据可视化的实现过程………………………………………………………………15
4.3.1 数据处理………………………………………………………………………15
4.3.2 数据可视化的一般步骤………………………………………………………15
[资料来源:THINK58.com]
4.4 数据可视化方法………………………………………………………………………16
4.4.1 走势图Line……………………………………………………………………16
4.4.2 箱型图Boxplot ………………………………………………………………17
4.4.3 饼图Pie………………………………………………………………………18
4.4.4 热力图HeatMap………………………………………………………………18 [资料来源:www.THINK58.com]
4.5 数据可视化结果和分析………………………………………………………………20
4.5.1 近三年北京AQI全年走势图 ………………………………………………20
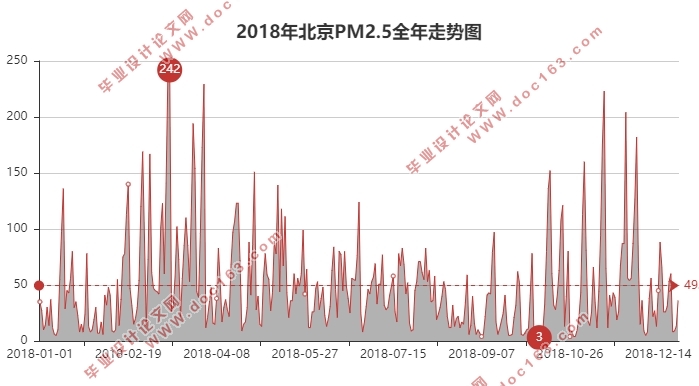
4.5.2 近三年北京PM2.5全年走势图 ……………………………………………21
4.5.3 2018年北京月均AQI走势图 ………………………………………………22
4.5.4 2018年北京月均PM2.5走势图 ……………………………………………22
4.5.5 2018年北京季度AQI箱型图 ………………………………………………23
4.5.6 2018年北京季度PM2.5箱型图 ……………………………………………23
4.5.7 2018年北京PM2.5指数日历图 ……………………………………………24
4.5.8 2018年北京全年空气质量情况 ……………………………………………25
4.6 本章小结……………………………………………………………………………… 25
第5章 京津冀上广深空气质量数据可视化分析……………………25
5.1 2018年京津冀上广深AQI全年走势图可视化与分析………………………………25
5.2 2018年京津冀上广深PM2.5全年走势图可视化与分析……………………………26
5.3 2018年京津冀上广深全年空气质量情况可视化与分析……………………………27
5.4 本章小结………………………………………………………………………………27
第6章 总结与展望……………………………………………………28
6.1 总结……………………………………………………………………………………28
6.2 展望……………………………………………………………………………………28 [资料来源:http://THINK58.com]
参考文献 ………………………………………………………………29
致谢 ……………………………………………………………………30
[资料来源:THINK58.com]
